

I remember the sinking feeling when a cheap pipe burst in my first project. The cleanup cost more than the pipe itself. That’s when I learned the real value isn’t in the price tag.
To calculate ROI for premium pipe materials, use this formula: (Net Benefits / Total Costs) x 100. Net Benefits are long-term savings minus initial cost. Total Costs include material, installation, and maintenance. A positive ROI means the premium material pays for itself over time.
But that simple formula hides a complex reality. What costs do you really count? How do you put a dollar value on reliability? Let’s break it down so you can make a choice that saves money for decades, not just today.
What is the basic formula for calculating ROI on pipe materials?
Staring at a spreadsheet, I used to just guess. Now, I use a clear formula. It turns a gut feeling into a solid business case anyone can understand.
The basic ROI formula for pipe materials is: ROI = (Total Lifetime Savings – Total Initial Cost) / Total Initial Cost. You then multiply by 100 to get a percentage. This shows you how much money you save (or lose) for every dollar you spend upfront on better materials.

Let’s dive deeper into what each part of this formula really means. It’s not just plugging in numbers. You need to understand the story each number tells.
Breaking Down the ROI Formula Components
The formula has two main parts: the total lifetime savings and the total initial cost. The ‘lifetime’ part is crucial. We are not comparing just year one. We are comparing the entire useful life of the piping system. For a standard project, this could be 20, 30, or even 50 years. You must define this timeframe first.
‘Total Initial Cost’ is more than the invoice from the supplier. It includes the purchase price of the pipe, plus all fittings, valves, and specialized joining materials. It also must include the labor cost for installation. Premium materials sometimes need special tools or trained installers, which can be more expensive.
‘Total Lifetime Savings’ is where the magic happens. This is the money you *don’t* spend because you chose a better pipe. It includes reduced repair costs, lower water or energy loss, less frequent maintenance shutdowns, and avoided costs from leaks or failures. Quantifying these requires looking at historical data or manufacturer warranties.
| Cost Component | Basic Pipe Material | Premium Pipe Material | Notes |
|---|---|---|---|
| Material Cost (per ft) | $2.50 | $5.00 | Initial premium is 100% higher. |
| Installation Labor (per ft) | $3.00 | $3.50 | May require special training/tools. |
| Expected Repair Costs (Years 1-10) | $500 | $50 | Based on failure rate data. |
| Energy Loss Cost (Annual) | $120 | $30 | Due to better insulation/flow. |
A Simple Worked Example
Imagine a 500-foot water line. Basic PVC costs $2.50/ft, and premium PEX costs $5.00/ft. Installation is $3.00/ft for PVC and $3.50/ft for PEX.
- Initial Cost (PVC): (500ft * $2.50) + (500ft * $3.00) = $1,250 + $1,500 = $2,750
- Initial Cost (PEX): (500ft * $5.00) + (500ft * $3.50) = $2,500 + $1,750 = $4,250
Now, assume over 10 years, the PVC line needs $500 in repairs and loses $120/year in heating costs ($1,200 total). The PEX line needs only $50 in repairs and loses $30/year ($300 total).
- 10-Year Cost (PVC): $2,750 + $500 + $1,200 = $4,450
- 10-Year Cost (PEX): $4,250 + $50 + $300 = $4,600
In this 10-year view, PVC seems cheaper. But what about year 11? The PVC might fail completely, while the PEX keeps going. This shows why your time horizon changes everything.
What are the key cost factors to include in the ROI calculation?
I once missed a huge cost: system downtime. My calculation was perfect, but the project still lost money. I learned to look beyond the obvious line items.
Key cost factors include direct material and labor, indirect installation costs (permits, equipment), long-term operational costs (energy, water loss), and risk mitigation costs (repairs, downtime, insurance). Ignoring any of these can make a good investment look bad, or vice versa.
Let’s categorize these costs to ensure nothing slips through the cracks. Think of it in four buckets: Acquisition, Installation, Operation, and Risk.
Acquisition Costs: More Than a Price Tag
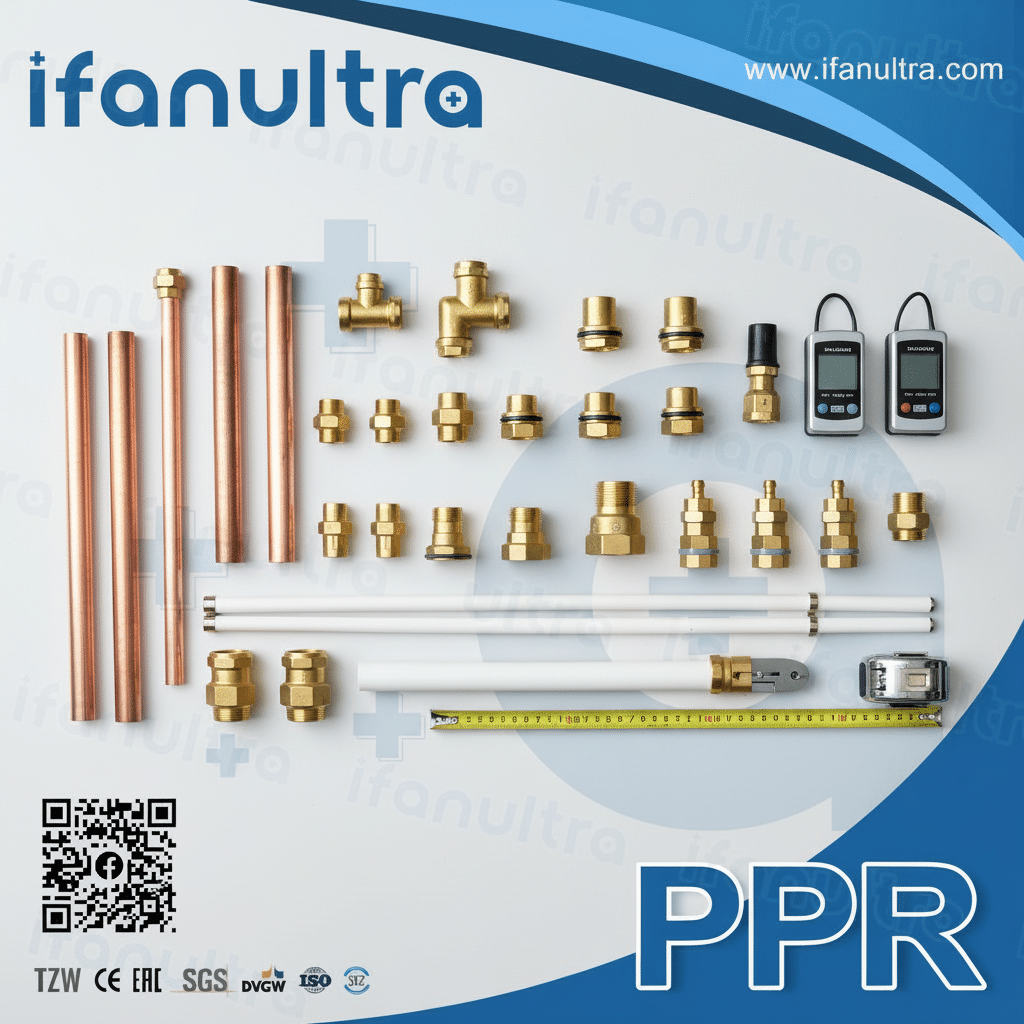
This is the cost to buy the physical system. It seems simple, but details matter. You have the base pipe cost. Then add every coupling, elbow, tee, valve, and hanger. Premium systems sometimes use fewer fittings, which can offset higher per-foot pipe cost. Don’t forget delivery fees, taxes, and any supplier surcharges. If the material requires special storage (like out of sunlight), factor that in too.
Installation & Commissioning Costs
This is where projects vary wildly. Labor rates are obvious. But also consider:
- Skill Level: Can your regular crew install it, or do you need a certified specialist?
- Tools & Equipment: Does it need a special fusion machine, crimper, or solvent?
- Time: Does it install faster (saving labor) or slower (costing more)?
- Permits & Inspections: Some advanced materials may have different code requirements.
- System Flush & Testing: Commissioning a complex system takes time and materials.
| Cost Category | Typical Inclusions | Often Forgotten Items |
|---|---|---|
| Acquisition | Pipe, fittings, valves | Shipping, taxes, special packaging |
| Installation | Labor, equipment rental | Permit fees, inspector time, crew training |
| Operation | Pumping energy, water loss | Chemical treatment, filtration needs |
| Risque | Planned maintenance | Business interruption, warranty admin, insurance deductibles |
Long-Term Operational Costs
This is the cost to run the system day-to-day. For pumping systems, a smoother interior pipe can reduce friction, saving significant energy costs over decades. For hot water lines, better insulation properties mean less heat loss. For water supply, a corrosion-resistant pipe means no water loss from pinhole leaks and potentially lower water treatment costs. These are recurring annual costs that add up tremendously.
The Hidden Giant: Risk Mitigation Costs
This is the most commonly overlooked area. It’s the cost of things going wrong. Assign a realistic probability and cost to these events:
- Repair Costs: Parts, labor, and access (e.g., breaking into a wall).
- Downtime/Business Interruption: If a pipe services a production line or a hospital wing, a failure stops revenue or critical operations.
- Damage to Property/Inventory: Water damage to building finishes, equipment, or stock.
- Warranty Value: A longer, transferable warranty from a premium manufacturer is a financial asset that reduces future risk.
- Insurance Premiums: Some systems may lead to lower property insurance costs.
Putting a number on ‘peace of mind’ felt impossible. Then I started translating benefits into avoided costs. That’s the key to seeing the true value.
Quantify long-term benefits by calculating Avoided Costs. Estimate the cost of failures, repairs, and inefficiencies for a standard pipe over your timeframe. Then subtract the expected cost of those same events for the premium pipe. The difference is your quantifiable financial benefit.
Benefits aren’t just theoretical. They are future expenses that never happen. Your job is to forecast those expenses as accurately as possible for both material choices.
Method 1: Using Historical Failure Data
The best data comes from your own past projects or maintenance records. How often did you repair the old galvanized steel lines? What was the average cost? If you lack data, look to industry studies, manufacturer testing reports, or even plumbing association publications. They often publish mean time between failures (MTBF) for different materials in various applications (e.g., potable water vs. chemical transport).
Method 2: Modeling Efficiency Gains
For systems that move fluids, hydraulic efficiency is a major benefit. A pipe with a larger internal diameter or a smoother lining (like HDPE vs. concrete) creates less friction. You can use standard hydraulic equations or software to model the pressure drop. Then, translate that into pump energy savings. A small efficiency gain, multiplied by a large pump running 24/7 for 20 years, equals thousands of dollars.
| Benefit Type | How to Quantify It | Example Calculation |
|---|---|---|
| Reduced Repairs | (Failure Rate A – Failure Rate B) * Avg. Repair Cost | (0.1 failures/yr – 0.02 failures/yr) * $500/repair = $40/yr savings |
| Energy Savings | Pump Power (kW) * Runtime * $/kWh * Efficiency Gain % | 10kW * 8,760hrs/yr * $0.12/kWh * 5% = $420/yr savings |
| Water Conservation | Gallons Lost/Day * 365 * Cost/Gallon | 5 gal/day * 365 * $0.005/gal = $9.13/yr savings |
| Extended System Life | Delay Capital Replacement Cost by X Years | Avoid $20,000 replacement for 5 years = $4,000/yr benefit |
Method 3: Valuing Extended Lifespan and Warranty
A pipe that lasts 50 years instead of 25 has immense value. You delay the massive capital expense of a full system replacement. To quantify this, take the estimated replacement cost and use a simple straight-line method: Replacement Cost / Extended Life (in years) = Annual Benefit. For example, delaying a $100,000 replacement by 25 years provides a $4,000 per year benefit. Also, a robust manufacturer’s warranty that covers parts and labor for 25 years is a direct financial transfer of risk back to the supplier, which has a calculable value.
Method 4: The Intangible to Tangible Conversion
Some benefits seem intangible but can be linked to cost. Improved water quality might reduce filter replacement frequency. Corrosion resistance might mean you don’t need a corrosion inhibitor chemical feed system. Reduced leak risk in a data center might justify a lower insurance premium. Always ask: “If this benefit is real, what current or future cost does it allow me to reduce or eliminate?”
What are common mistakes to avoid when calculating pipe material ROI?
I’ve made every mistake in the book. The worst was using a too-short timeline. It made the right choice look wrong and cost my client later.
Common mistakes include using an unrealistic time horizon, ignoring indirect and soft costs, failing to account for inflation and discount rates, relying on outdated cost data, and comparing materials with different performance specs. These errors skew the result and lead to poor investment decisions.

An accurate ROI calculation is as much about what you exclude as what you include. Here are the pitfalls that can completely derail your analysis.
Mistake 1: The “First Cost” Tunnel Vision
This is the biggest and most tempting error. Focusing only on the initial purchase and installation price ignores the total cost of ownership. A cheaper pipe that requires constant maintenance, wastes energy, and fails early will always lose in a true lifecycle analysis. The ROI calculation forces you to look beyond the first invoice.
Mistake 2: An Inappropriate Time Horizon
Using the warranty period of the cheaper material as your analysis period is a trap. If Material A has a 10-year warranty and Material B has a 50-year life, analyzing only 10 years unfairly favors Material A. Your time horizon should match the expected service life of the *longest-lasting* option or the planned life of the building/facility itself.
Mistake 3: Ignoring the Time Value of Money (Discounting)
A dollar saved in 20 years is not worth a dollar today. For long-term projects, you should apply a discount rate to future savings and costs to get their “Net Present Value” (NPV). This is a more sophisticated financial analysis. Not doing it can overstate the value of distant future benefits. A simple ROI calculation often ignores this, which is acceptable for shorter timelines but a major flaw for 30+ year analyses.
| Common Mistake | Why It’s Wrong | How to Fix It |
|---|---|---|
| Short Time Horizon | Captures only early costs, misses long-term failures. | Use the expected lifespan of the building or the premium material. |
| Ignoring Labor Rate Changes | Future repair labor will cost more than today’s labor. | Apply a modest annual inflation factor (2-3%) to future labor costs. |
| Comparing Different Systems | Comparing a basic design to an optimized premium one. | Compare materials within the same system design and performance specs. |
| Overlooking Disposal Cost | Some materials are costly/difficult to dispose of at end-of-life. | Include estimated end-of-life removal and disposal/recycling costs. |
Mistake 4: Using Static, Outdated Data
The world changes. Energy costs rise. Labor rates increase. Water becomes more expensive. Using today’s utility rates for a 40-year analysis is naive. Build simple escalation factors into your model for key costs like energy, water, and labor. While you can’t predict the future, assuming current prices stay flat is almost certainly wrong.
Mistake 5: Not Doing a Sensitivity Analysis
Your initial estimates are guesses. What if energy prices double? What if the repair cost is 50% higher? A good ROI model tests these “what-if” scenarios. Run the calculation with your best guess, a pessimistic guess, and an optimistic guess. If the ROI is strongly positive in all scenarios, it’s a robust decision. If it’s only positive in the best case, the investment is risky.
Conclusion
Calculating ROI moves the decision from guesswork to strategy. It shows the true cost of cheap pipes and the real savings in quality.


 English
 Español
 Français
 Português do Brasil