

A client once asked me for “green pipes” but had no idea how to measure their actual environmental impact. This confusion is common, so let’s clear it up.
To calculate your piping project’s carbon footprint, you must account for emissions across four key stages: raw material extraction and production, transportation to site, installation and operational energy use, and end-of-life disposal or recycling. Each stage requires specific data on material quantities, energy sources, and distances traveled, which you then multiply by established emission factors.
Understanding this process helps you make informed choices that reduce environmental impact while meeting project requirements.
What Are the Emission Factors for Raw Material Extraction and Pipe Production?
Many buyers focus only on the pipe’s price, not the environmental cost of making it. This oversight can hide significant carbon impacts.
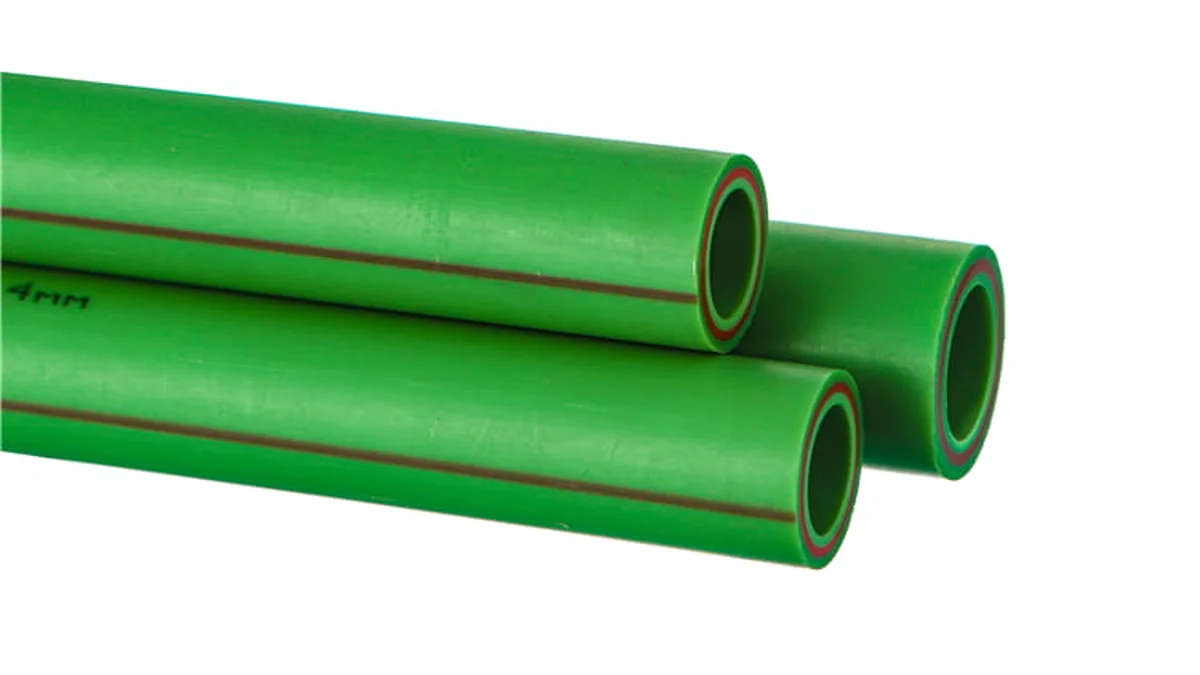
Emission factors for raw material extraction and pipe production represent the amount of CO2 equivalent released per unit of material (usually per kilogram or ton). These factors vary significantly by pipe material—for example, producing virgin PVC has a different carbon intensity than producing recycled PP-R or ductile iron. You obtain these factors from industry databases, environmental product declarations (EPDs), or directly from manufacturers like IFAN.
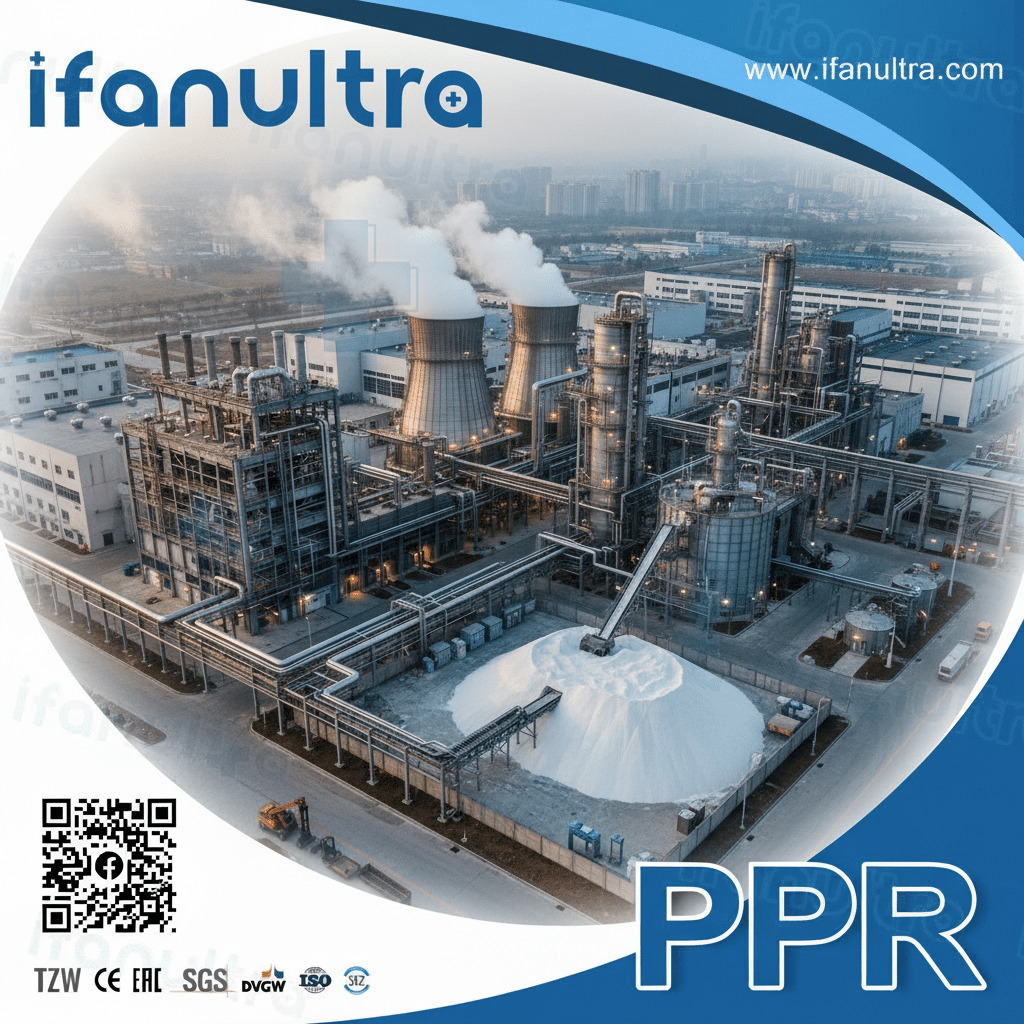
Understanding Cradle-to-Gate Emissions
The first stage of your piping project’s carbon footprint covers everything from extracting raw materials from the earth to the moment finished pipes leave the factory gate. This is often called “cradle-to-gate” emissions.
For plastic pipes like PP-R, this includes:
- Extracting and processing crude oil or natural gas into polymer resins
- Transporting resins to the pipe manufacturing facility
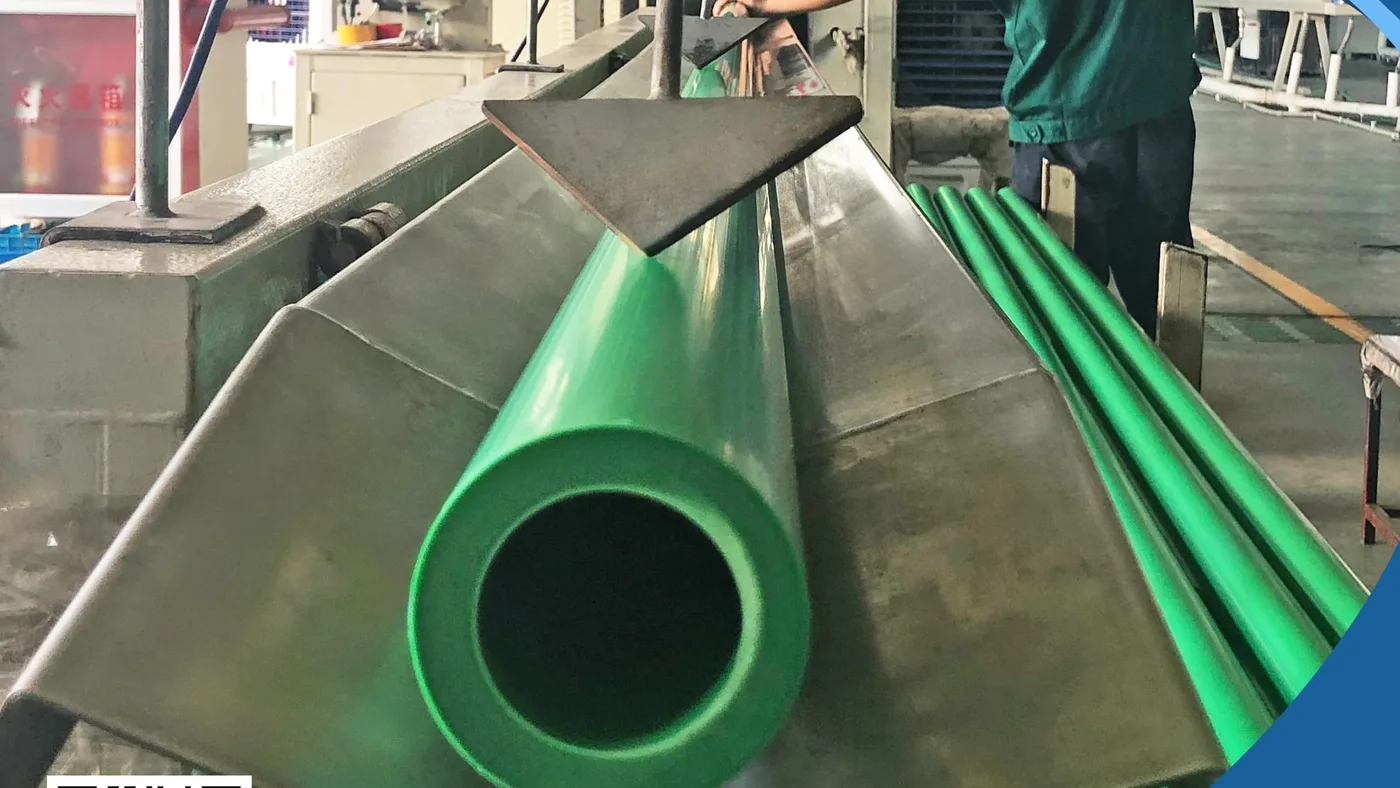
- The energy used in the extrusion process itself
- Manufacturing of fittings and other components
For metal pipes like copper or steel, it includes:
- Mining and refining metal ores (highly energy-intensive)
- Smelting and alloying processes
- Forming pipes through casting or drawing
Where to Find Reliable Emission Factors
You cannot guess these numbers. You need reliable data sources:
1. Environmental Product Declarations (EPDs): These are standardized documents that report a product’s lifetime environmental impact. Reputable manufacturers publish EPDs verified by third parties. IFAN provides EPDs for our major product lines, giving you transparent, reliable data.
2. Industry Databases:
- ICE Database: The Inventory of Carbon and Energy, developed in the UK, provides emission factors for common building materials.
- Ecoinvent: A comprehensive Swiss database used worldwide for life cycle assessment.
- US EPA’s EPA database: Contains factors for various industrial processes.
3. Manufacturer Data: Direct requests to suppliers can yield specific numbers. At IFAN, we provide carbon footprint data for our PP-R pipes upon request.
Comparing Emission Factors by Material
The table below shows approximate emission factors for common piping materials. These are industry averages and will vary by specific product and manufacturer.
| Pipe Material | Emission Factor (kg CO2e per kg) | Notes |
|---|---|---|
| PP-R (Virgin) | 1.8 – 2.5 | Lower than metals, higher than some other plastics |
| PP-R (Recycled Content) | 0.9 – 1.4 | Significant reduction from virgin material |
| PVC | 1.9 – 2.4 | Similar range to PP-R |
| HDPE | 1.6 – 2.2 | Slightly lower than PP-R on average |
| Copper | 3.5 – 5.0 | High due to mining and smelting energy |
| Ductile Iron | 1.8 – 2.8 | Varies widely by recycled content |
| Stainless Steel | 5.0 – 7.0 | Very high due to alloying elements |
Practical Calculation Steps
To calculate this stage for your project:
Step 1: List all pipe materials and their weights. Include fittings, which can add 15-25% to total material weight.
Step 2: Obtain the correct emission factor for each specific product. Using averages introduces error.
Step 3: Multiply: Material weight (kg) × Emission factor (kg CO2e/kg) = Stage 1 footprint.
Exemple : If your project uses 1,000 kg of virgin PP-R pipe with an emission factor of 2.2 kg CO2e/kg, the raw material and production footprint is 2,200 kg CO2e.
How Do You Account for Transportation Emissions From Factory to Project Site?
Pipes travel long distances, and those miles add carbon. I’ve seen projects where transport emissions exceeded production emissions due to poor planning.
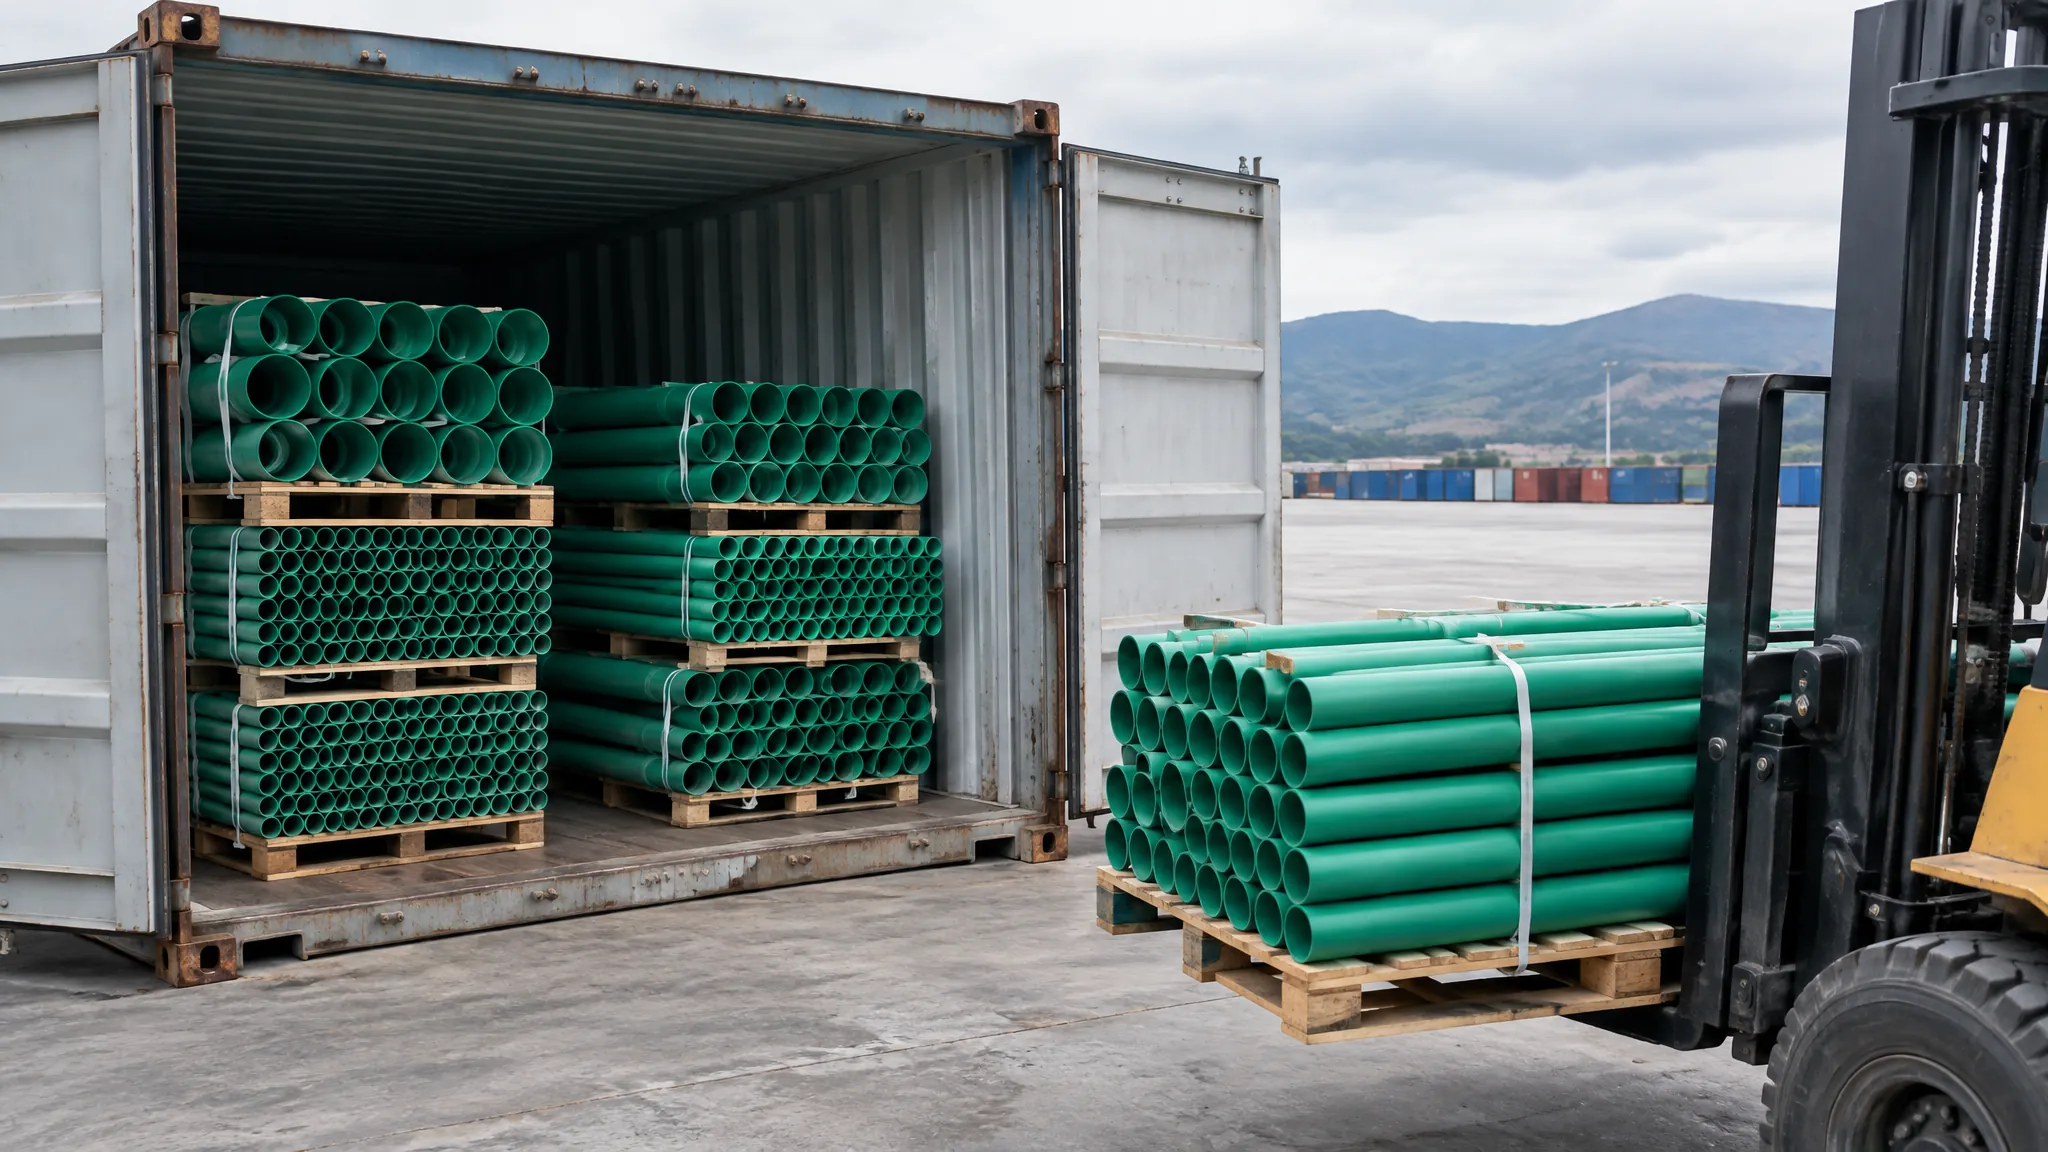
To account for transportation emissions, you multiply the distance traveled by the weight of materials and an emission factor specific to the transport mode (truck, ship, rail, or air). Each mode has a different carbon intensity per ton-kilometer, with air freight being highest and sea freight lowest for long distances. You must also consider multiple legs—factory to port, ocean shipment, and final delivery to site.
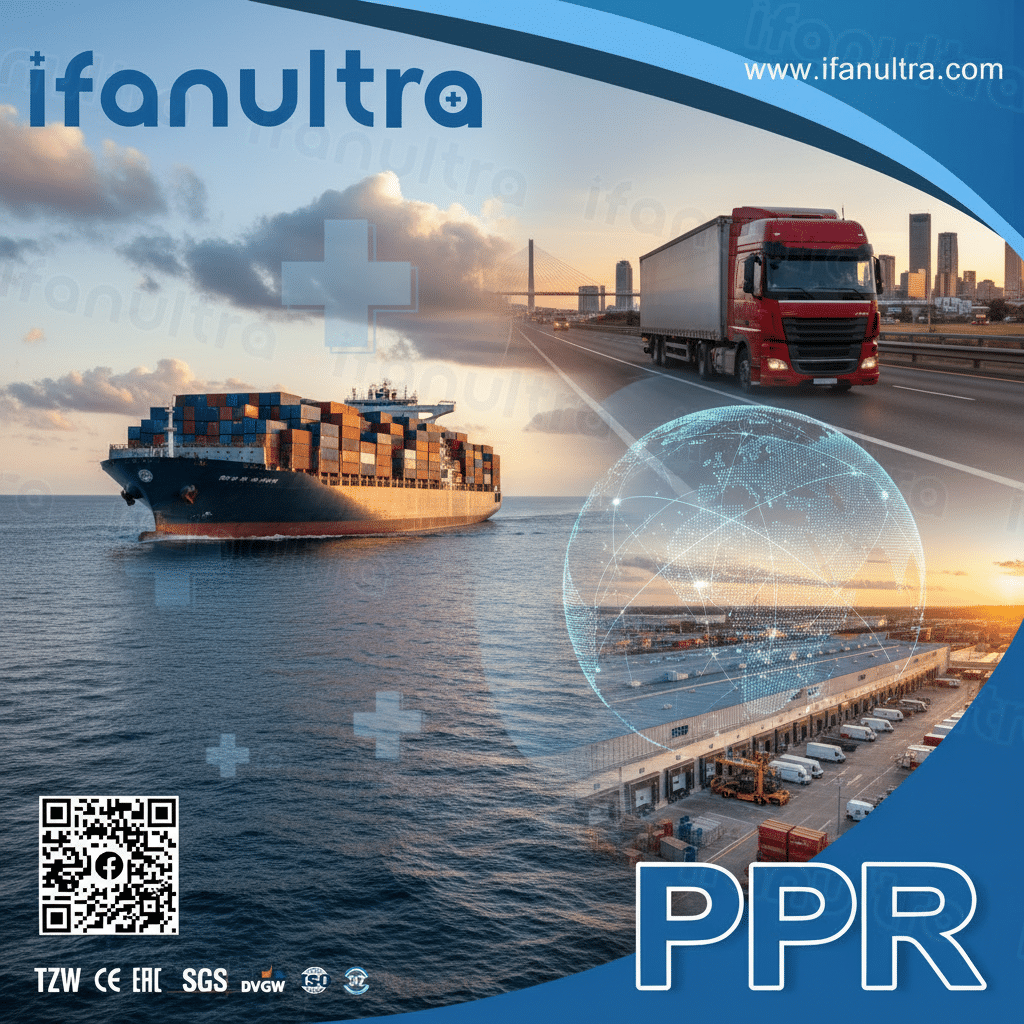
Breaking Down the Logistics Chain
Transport rarely involves a single step. Your pipes typically travel through several stages:
1. Factory to Export Port: Usually by truck, sometimes by rail. Distance varies from a few kilometers to hundreds.
2. Ocean or Air Freight: International shipments cross oceans. A container from Shanghai to Rotterdam travels about 20,000 km by sea. Air freight is faster but emits 50-100 times more CO2 per ton-km.
3. Import Port to Warehouse or Project Site: Another truck or rail leg at the destination.
4. Final Distribution: Small trucks may deliver to specific construction sites.
Emission Factors by Transport Mode
The table below shows typical emission factors for different transport methods. These are global averages; actual factors depend on vehicle efficiency, load factors, and routing.
| Transport Mode | Emission Factor (kg CO2e per ton-km) | Best Use Case |
|---|---|---|
| Ocean Freight (Container Ship) | 0.015 – 0.025 | International long-distance, heavy materials |
| Rail Freight | 0.020 – 0.035 | Continental overland transport |
| Truck (Heavy, Full Load) | 0.080 – 0.120 | Regional distribution, final delivery |
| Truck (Partial Load) | 0.150 – 0.250 | Less efficient due to unused capacity |
| Air Freight | 0.500 – 1.500 | Emergency shipments only—extremely high |
Practical Calculation Steps
Follow this process to calculate transport emissions:
Step 1: Map your complete logistics chain. Identify each segment and its distance.
Step 2: Determine the total weight shipped. Include packaging materials, which add weight.
Step 3: For each segment, multiply: Weight (tons) × Distance (km) × Mode Factor = Segment emissions.
Step 4: Sum all segments for total transport footprint.
Example Calculation
Let’s calculate for a 10-ton PP-R pipe shipment from IFAN’s factory in China to a project site in Moscow:
| Segment | Distance (km) | Mode | Facteur | Calculation | Emissions (kg CO2e) |
|---|---|---|---|---|---|
| Factory to Shanghai Port | 300 | Truck | 0.100 | 10 × 300 × 0.100 | 300 |
| Shanghai to St. Petersburg | 18,000 | Ship | 0.020 | 10 × 18,000 × 0.020 | 3,600 |
| St. Petersburg to Moscow | 700 | Truck | 0.100 | 10 × 700 × 0.100 | 700 |
| Total | 4,600 kg CO2e |
Practical Tips to Reduce Transport Emissions
- Consolidate shipments: Full containers are more efficient than partial loads
- Choose sea freight over air whenever possible
- Source locally when feasible to reduce long-distance transport
- Use lightweight materials like PP-R instead of heavier metals
What Is the Role of Installation Energy and Long-Term Operational Efficiency?
Installation seems temporary, but its carbon impact lasts. I’ve watched crews waste energy on site, unaware of the footprint they were creating.
Installation energy includes fuel for equipment (excavators, welding machines, generators) and electricity for tools. Long-term operational efficiency refers to the energy required to pump water through the pipes over their lifetime, which depends on pipe diameter, interior smoothness, and system design. Smoother pipes like PP-R require less pumping energy, reducing operational carbon for decades.

Installation Phase Emissions
The installation phase often gets overlooked because it seems temporary. However, construction activities can contribute significantly to total project carbon.
Sources of installation emissions include:
1. Equipment Fuel: Excavators for trenching, cranes for lifting, generators for site power. All burn diesel or gasoline.
2. Tool Electricity: Welding machines for PP-R fusion, saws for cutting, compressors for testing.
3. Temporary Works: Formwork, shoring, dewatering pumps.
4. Worker Transport: Commuting to and from site adds up over the project duration.
Calculating Installation Emissions
This requires estimating equipment hours and fuel consumption:
Step 1: List all powered equipment used during installation.
Step 2: Estimate operating hours and fuel consumption rate.
Step 3: Multiply fuel used by emission factor (diesel: ~2.68 kg CO2e per liter; gasoline: ~2.31 kg CO2e per liter).
Step 4: Add electricity consumption (kWh) multiplied by local grid emission factor.
Long-Term Operational Efficiency
This is where material choice makes a huge difference over time. The pipe’s interior surface affects pumping energy:
Hazen-Williams Roughness Coefficient (C-Factor):
- PP-R: C = 150 (very smooth)
- Copper: C = 130-140 (smooth but can roughen over time)
- Steel: C = 100-120 (rougher, especially after corrosion)
- Concrete: C = 80-100 (very rough)
A higher C-factor means less friction, requiring less pumping energy.
Energy Savings Over 50 Years
The table below compares pumping energy requirements for different pipe materials over a 50-year lifespan, assuming identical flow rates and distances:
| Pipe Material | Roughness Factor | Relative Pumping Energy | 50-Year Energy Cost (kWh) |
|---|---|---|---|
| PP-R | 150 | Baseline (100%) | 100,000 |
| Copper (New) | 140 | 107% | 107,000 |
| Copper (Aged) | 130 | 115% | 115,000 |
| Steel (New) | 120 | 125% | 125,000 |
| Steel (Corroded) | 100 | 150% | 150,000 |
Note: Based on a hypothetical municipal water system pumping 1,000 m³/day over 1 km. Actual numbers vary by system.
Calculating Operational Footprint
Step 1: Determine pump energy requirements for your system design.
Step 2: Estimate annual pumping hours and power consumption.
Step 3: Multiply annual kWh by grid emission factor (varies by country: 0.3-0.8 kg CO2e/kWh).
Step 4: Multiply by system design life (typically 50 years for PP-R).
Practical Example
A PP-R system requiring 100,000 kWh over 50 years in a region with 0.5 kg CO2e/kWh grid intensity:
100,000 kWh × 0.5 = 50,000 kg CO2e operational footprint.
The same system in aged steel (150,000 kWh) would emit 75,000 kg CO2e—50% more.
How Can End-of-Life Recycling or Disposal Be Factored Into the Total Footprint?
What happens at the end matters as much as the beginning. I’ve seen perfectly good materials wasted in landfills when recycling was possible.
End-of-life emissions depend on what happens to the pipes after removal. Recycling avoids the carbon-intensive production of virgin materials and typically results in a “carbon credit” that reduces the project’s total footprint. Landfilling or incineration, however, adds emissions from transportation, processing, and potential methane release. You factor this in by estimating the percentage of material recycled versus landfilled and applying appropriate emission factors for each disposal method.
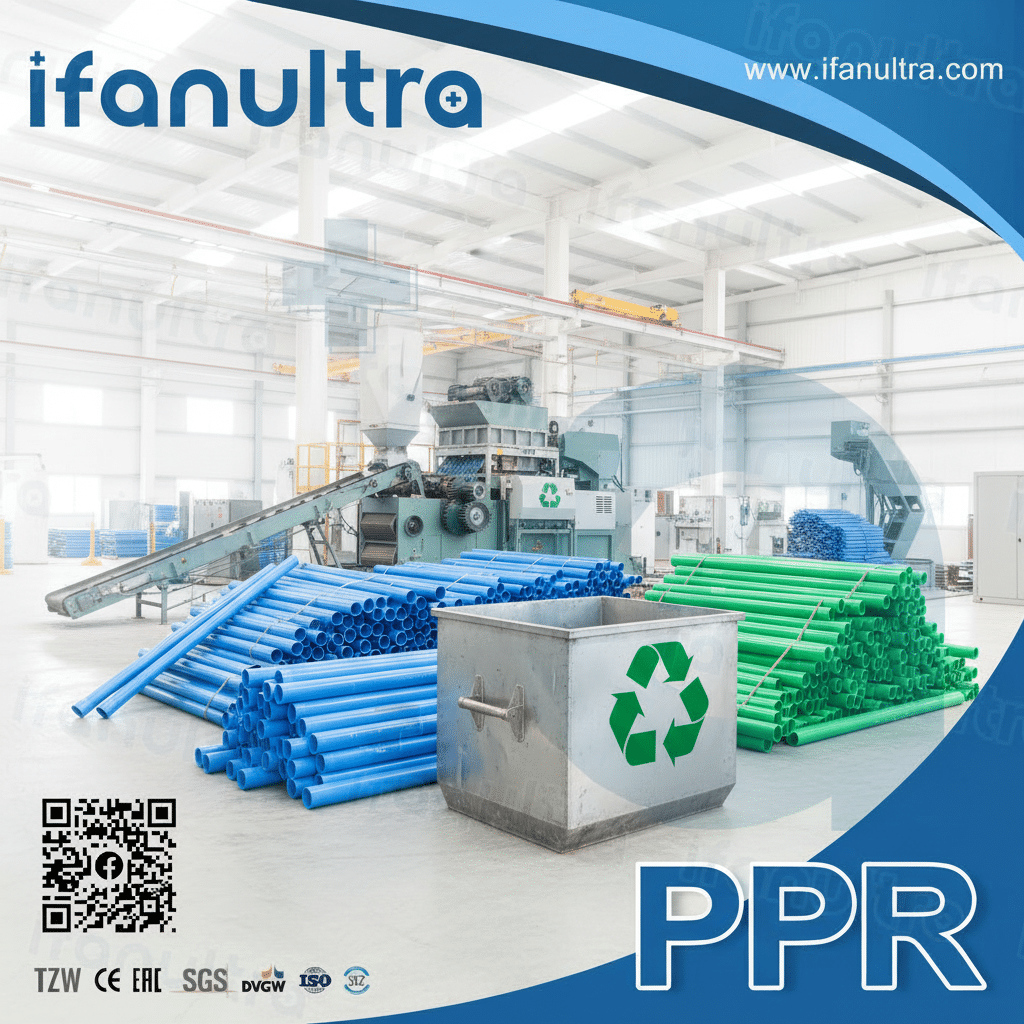
Understanding End-of-Life Scenarios
Pipes can meet several fates after their service life:
1. Recycling: Material is collected, cleaned, shredded, and reprocessed into new products. This avoids virgin production emissions.
2. Incineration (with energy recovery): Pipes are burned to generate energy. This releases CO2 but offsets fossil fuel use.
3. Landfill: Pipes are buried. Plastic pipes are inert but persist for centuries. No energy recovery, no material reuse.
4. Reuse: Pipes are extracted intact and reinstalled elsewhere. This is rare but ideal.
Calculating End-of-Life Footprint
The calculation follows a simple formula but requires assumptions about future recycling rates:
Step 1: Estimate the percentage of material that will be recycled versus landfilled or incinerated. Current recycling rates for plastic pipes vary by region from 10-40%.
Step 2: Calculate avoided emissions from recycling: Material weight (kg) × Virgin emission factor (kg CO2e/kg) × Recycling rate. This is a negative number (credit).
Step 3: Calculate disposal emissions: Material weight × Disposal factor (landfill or incineration).
Step 4: Combine for net end-of-life impact.
Emission Factors for End-of-Life
| End-of-Life Pathway | Emission Factor (kg CO2e per kg) | Notes |
|---|---|---|
| Recycling (Credit) | -1.5 to -2.2 (varies by material) | Avoided virgin production emissions |
| Incineration (with energy recovery) | +1.0 to +1.8 | CO2 released, partial energy offset |
| Landfill (non-biogenic) | +0.01 to +0.05 | Minimal direct emissions; no recovery |
| Landfill (with methane capture) | Near zero | Captured methane used for energy |
Practical Example
Consider 10,000 kg of PP-R pipe at end-of-life, with 40% recycled and 60% landfilled:
| Component | Calculation | Emissions (kg CO2e) |
|---|---|---|
| Recycling Credit | 10,000 kg × 40% × 2.2 (credit) | -8,800 |
| Landfill | 10,000 kg × 60% × 0.03 | +180 |
| Net End-of-Life Impact | -8,620 kg CO2e |
This negative number means the project effectively stores carbon benefit for the future.
Design for Recycling
Practical steps to improve end-of-life outcomes:
- Choose mono-material systems: PP-R systems using only PP-R fittings are fully recyclable. Mixed-material systems (plastic with metal fittings) are harder to recycle.
- Document materials used: Leave records for future generations so they know what materials are present.
- Design for disassembly: Use mechanical joints where practical, allowing easier separation at end-of-life.
- Specify recycled content: IFAN offers PP-R pipes with certified recycled content, reducing virgin material demand.
IFAN’s Commitment to Circularity
At IFAN, we design products with their entire lifecycle in mind. Our PP-R pipes are:
- Fully recyclable as polypropylene material
- Available with recycled content to reduce virgin material use
- Documented with EPDs providing transparent carbon data
- Durable for 50+ years delaying end-of-life impacts
Conclusion
Calculating your piping project’s carbon footprint requires examining material production, transport, installation, operation, and end-of-life stages. For transparent, low-carbon solutions with full lifecycle data, choose IFAN’s PP-R piping systems—designed for durability, efficiency, and recyclability.



 English
 Español
 Français
 Português do Brasil